
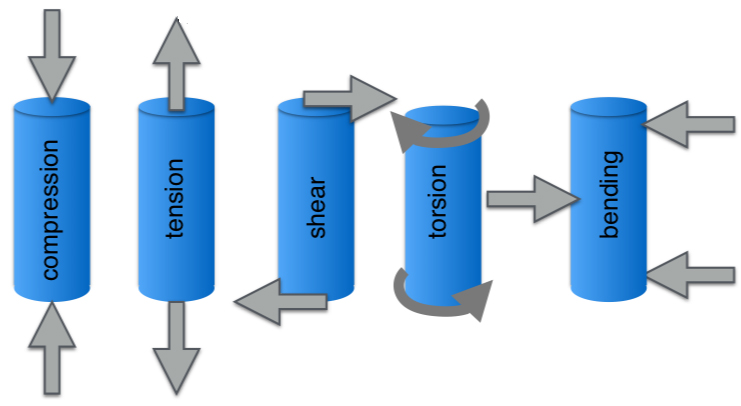
Every component in a linear motion system experiences some form of loading due to applied forces or motion. The component’s reactions to these loads are described by its mechanical properties.
For components subjected to tension or compression — such as load-carrying balls and rollers, shafts mounted vertically, or fastening and joining hardware — the mechanical properties of stress and strain play an important role in determining whether the component can withstand the application’s loading conditions.
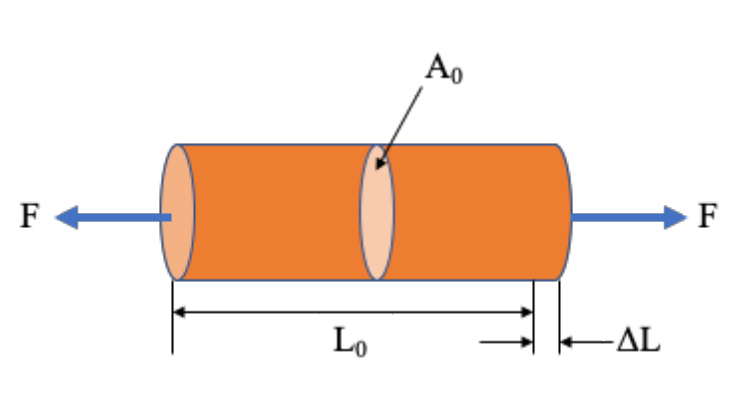
Stress is the force applied to a material, divided by the material’s cross-sectional area.
![]()
σ = stress (N/m2, Pa)
F = force (N)
A0 = original cross-sectional area (m2)
Strain is the deformation or displacement of material that results from an applied stress.
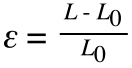
ε = strain
L = length after load is applied (mm)
L0 = original length (mm)
Note: A material’s change in length (L – L0) is sometimes represented as δ.
The most common way to analyze the relationship between stress and strain for a particular material is with a stress-strain diagram.
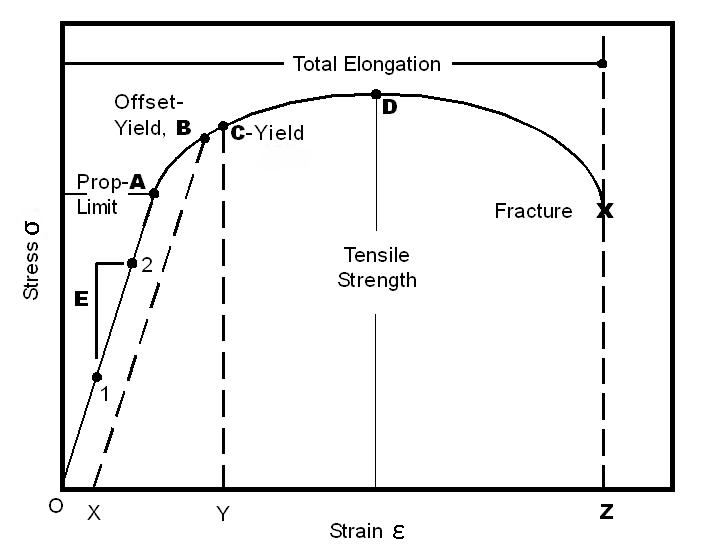
Many materials exhibit a proportional relationship between stress and strain up to certain point, referred to as the proportional limit, shown here as point “A.” This stress-strain relationship is known as Hooke’s Law, and in this region, the slope of the stress-strain curve is referred to as the modulus of elasticity (aka Young’s modulus), denoted E.
![]()
The modulus of elasticity is essentially a measure of stiffness and is one of the factors used to calculate a material’s deflection under load.
Just beyond the proportional limit is the elastic limit, at which point the material transitions from elastic behavior, where any deformation due to applied stress is reversed when the force is removed, to plastic behavior, where deformations caused by stress remain even after the stress is removed. For many materials, the proportional limit and the elastic limit are the same or nearly equal. (In the stress-strain curve shown here, the proportional limit and the elastic limit are assumed to be the same.)
As long as the applied stresses are below the proportional limit, stress-strain relationships are the same whether the material is under tension or compression.
The yield point, shown here as point “C,” is the point where strain increases faster than stress (referred to as “strain hardening”), and the material experiences some amount of permanent deformation.
For materials that do not have a well-defined yield point, or whose yield point is difficult to determine, an offset yield strength — shown here as point “B” — is used. Offset yield strength is the stress that will cause a specified amount of permanent strain (typically 0.2 percent). It is found by drawing a line that crosses the X (strain) axis at 0.002 and runs parallel to the stress-strain line (slope = E). The point where this line intersects the stress-strain curve is the offset yield point.
Finally, at point “D,” where the curve begins to fall, the material’s ultimate tensile strength has been reached. This point denotes the maximum stress that can be applied to a material in tension before failure occurs.
The term “strength” can be used with various material properties (tensile strength, yield strength, shear strength, etc.). But regardless of the property being described, “strength” typically refers to a material’s resistance to failure, either through fracture or excessive deformation.
Note that in the discussion above, the original cross-sectional area and length (before any deformation had taken place) were used to calculate stress and strain, respectively. Thus, the diagram is referred to as an “engineering stress-strain diagram.” But as a material deforms, its cross-sectional area and length change. A stress-strain diagram that takes the instantaneous values of cross-sectional area and length to determine stress and strain is referred to as a “true stress-strain diagram.”
For most applications, the engineering stress-strain diagram is sufficient, since the differences between the engineering and true versions are very small below the material’s yield point.


Leave a Reply
You must be logged in to post a comment.